| Reports
|
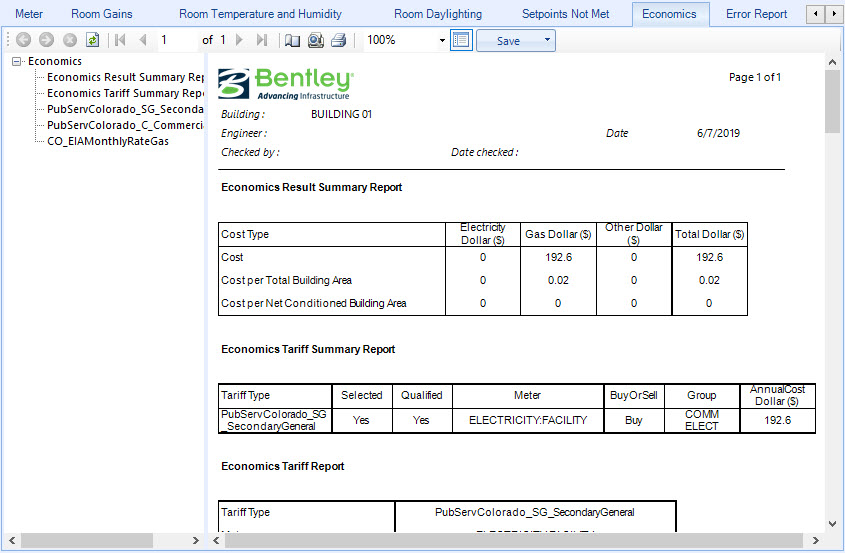
Located in the left panel of the Economics
tab, Summary Report and Tariff Reports can be selected to display
Economics data on tables in the data
display panel on the right side of the Economics
tab.
|
| Summary Report
|
Contains a standardized tabular output with two
reports that detail the simulated Economics or calculation of annual utility
costs for the project building.
-
Economics Result Summary Report — Displays a summary of multiple cost tariffs
defined for the building in the Properties
dialog box’s Properties
For: Building panel
Economics
sub panel. The report is in the form of a table with
the following columns:
-
Cost Type – Displays the three Cost Types for the report.
-
Electricity – Displays the simulated Electricity cost for each Cost Type.
-
Gas – Displays the simulated Gas cost for each Cost Type.
-
Other – Displays the simulated costs for other fuels for each Cost Type.
-
Total – Displays the Total of all the costs in each row.
-
Economics Tariff Summary Report — Displays a summary of each cost tariff
defined for the building in the Properties
dialog box’s Properties
For: Building panel Economics sub panel. The report is in the form of a table
with the following columns:
-
Tariff Type – Displays the cost tariff name.
-
Selected – Displays a value that indicates whether the tariff is selected for
simulation.
-
Qualified – Displays a value the indicates whether the cost tariff has
qualified or exceeded the threshold value defined in the cost tariff’s Cost
Qualify data object.
-
Meter – Displays the name of the Meter defined for the cost tariff. If none was
explicitly defined, it defaults to either Electricity:Facility or Gas:Facility.
-
BuyOrSell – Displays a value that indicates which BuyOrSell option is defined
for the cost tariff. Usually it is Buy unless a power generation system is
included in the building that generates more power than the building needs.
-
Group – Displays the group name of the tariff such as distribution,
transmission, supplier, etc. If more than one tariff with the same group name
is present and qualifies, only the lowest cost tariff is used.
-
AnnualCost – Displays the simulated total annual costs for the tariff.
|
| Tariff report for: [cost tariff name]
|
Contains a standardized tabular output report for
each cost tariff defined, which shows all components of all categories in the
calculation sequence on a 12 month basis. The economics report is automatically
created if any Cost Tariff objects are defined. The values reported are in the
units specified in the Cost Tariff object. The report includes two tables:
Economics Tariff Report and Economics Tariff Report Categories.
-
Economics Tariff Report — Contains a
summary report in the form of a table which shows if that tariff was selected,
if it was qualified, which qualifier disqualified the tariff, what meter it was
connected to, what group it was part of, and if the computation was based on a
user defined computation or was automatic.
-
Tariff Type – Displays the cost tariff name.
-
Meter – Displays the name of the Meter defined for the cost tariff. If none was
explicitly defined, it defaults to either Electricity:Facility or Gas:Facility.
-
Selected – Displays a value that indicates whether the tariff is selected for
simulation.
-
Group – Displays the group name of the tariff such as distribution,
transmission, supplier, etc. If more than one tariff with the same group name
is present and qualifies, only the lowest cost tariff is used.
-
Qualified – Displays a value the indicates whether the cost tariff has
qualified or exceeded the threshold value defined in the cost tariff’s Cost
Qualify data object.
-
Disqualified – Displays the disqualified tariff types.
-
Computation – Displays a value that indicates if the cost tariff computation
was based on a user defined computation or if it was automatic.
-
Units – Displays the cost tariff power units.
- Economics Tariff Report
Categories — Contains a report in the form of a table that shows
the monthly results of all the cost tariff Category Variables.
-
Month – Displays the twelve months of the year. Tariff report categories data
are then displayed for each month regardless of the simulation time period
length.
-
Sum – Displays the sum of the values for all rows for each table column.
- Max – Displays the maximum value in
each table column.
-
Energy Charges – Displays the monthly Energy Charges or direct charges issued
by the utility provider.
-
Demand Charges – Displays the monthly Demand Charges or charges specific to a
period in which the utility experiences high demands for it power production.
-
Service Charges – Displays the monthly Service Charges or additional charges
from the utility.
-
Basis – Displays the monthly Basis cost for the cost tariff. The Basis is the
sum of the energy, demand and service charges.
-
Adjustment Charges – Displays the monthly charge associated with an adjustment
variable. Adjustment Charges come from a utility when it requires that the
demand charge for a month with a low demand may be increased to be more
consistent with a month that set a higher demand charge.
-
Surcharge – Displays the monthly Surcharge charged by the utility.
- Sub
Total – Displays the monthly charges Sub Total before taxes are applied. The
Sub Total is the sum of the basis, adjustment charges and surcharge.
-
Taxes – Displays the monthly tax charges issued by the utility.
-
Total – Displays the monthly grand Total or the sum of all charges,
adjustments, surcharges and taxes.
Tip:
The variables assigned to the same category are added together. The above
mentioned Category Variables relationships can be visualized in the following
chart:
|
Energy Charges
|
|
|
|
|
|
|
|
Demand Charges
|
→
|
Basis
|
|
|
|
|
|
Service Charges
|
|
Adjustment Charges
|
→
|
Subtotal
|
→
|
Total
|
| |
|
Surcharge
|
|
Taxes
|
The Energy Charges, Demand Charges and Service Charges
are added together to form the Basis. The Basis, Adjustment Charges and
Surcharge are added together to form the Subtotal. The Subtotal and Taxes are
added together to be the Total. The total represents the total monthly charges
on that tariff for the energy source used.
|